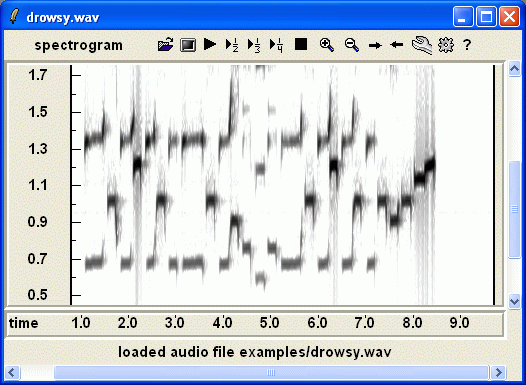
Note the text line "loaded audio file examples/..." that appears at the bottom of the window. This area often contains important messages and hints.
It is best to learn how to use this program by working through numerous examples. You can run these examples by running scribe and loading one of the indicated project files.
The key problem in transcribing or annotating an audio file is finding the
the melody in the spectrogram. For music played on a solo music which plays
only one note at a time (as opposed to a guitar or piano), the problem is
easy. For example, consider the home made
recording drowsy.wav. The spectrogram
is very simple and can be annotated automatically with good success.
Here is how the spectrogram looks, using an fft size of 512.

Note the text line "loaded audio file examples/..." that appears at
the bottom of the window. This area often contains important messages
and hints.
It is now a good idea to play around with the program and try different
settings. Click on the cfg menu button and select the spectrum
radio button. Try the different FFT sizes. The next image shows the same
spectrogram using a 1024 FFT.
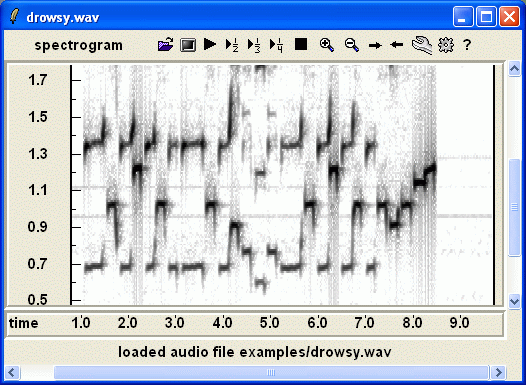
The analysis window size depends upon the
the FFT size, which affects the tradeoff between frequency and temporal
resolution. When you increase the FFT size you may find it necessary
to also adjust the brightness and contrast levels. When working with
more difficult material, you will find all of these controls essential
to getting the best visual representation of the information of interest.
Now switch from the spectrogram to midigram representation using the
top menu button. The display should now look something like below.
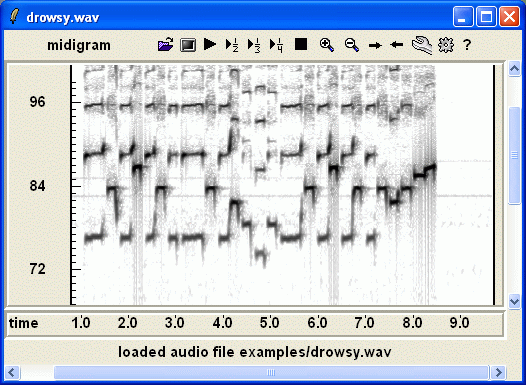
You may find it necessary to adjust the vertical scrolling.
You will find the midigram appears more complicated due to the presence
of the many partials. The first partial is double the frequency of
the fundamental, so it appears one octave higher. The next partial is
triple the frequency of the fundamental so it appears one octave plus
a fifth higher. To hear the pitch associated with each tone position
the mouse pointer over one of the horizontal bars in the midigram
or spectrogram and press the space bar. You should hear a short
beep corresponding to that pitch and a purple horizontal line will
appear temporarily at this pitch. To hear the original press the
right mouse button without moving the mouse pointer.
You can also view the correlogram, however, it is less meaningful and harder to interpret in this application. If you wish to see the spectrum and autocorrelation functions at a specific time, first set the cursor (vertical red line) at the time of interest by left clicking once in the spectrogram/midigram/ or correlogram. Be careful not to drag the cursor while pressing the button or else you will select a region. Now press the key `u' on the keyboard. Two additional windows will pop up with graphs. There are various controls in these windows that you can play with.
Note that occasionally, you will see an error message, FFT window out of bounds. Just click OK (one or more times) and carry on. This message indicates that you had not selected a start time (with the vertical red cursor), before pressing u. You will find that the spectrums and autocorrelation functions are automatically updated any time you move the cursor. Be careful not to move the cursor over those plots or else you will see other error messages. The program is still more of a research tool rather than a turnkey system. You can close these two windows, since they are not needed at this point.
Now for practice, you should try to annotate the spectrogram so
that it looks something like this.
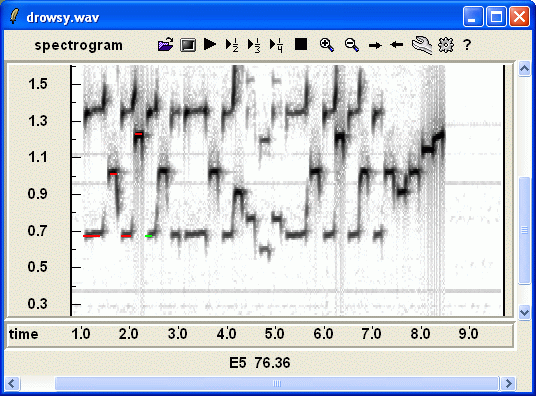
To do this, you use the mouse pointer, the space bar and `g' key on
your keyboard using this procedure. Place the mouse pointer over the
bar at about one second and 0.7 kHz and press the space bar. You should
see a horizontal purple line going through this bar. If it is too high
or too low just adjust the position of the mouse cursor and press the
space bar again. When it is finally at the right pitch, you need to
specify the time and duration of the note by dragging the mouse
while holding the mouse button button. The following image, shows
how the screen may look like.
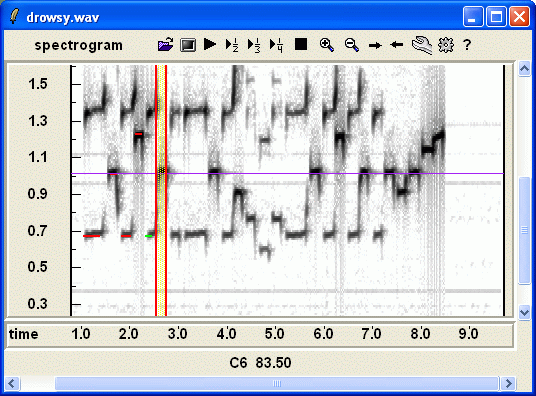
Now press the g key on your keyboard, and that note will be grabbed.
After grabbing a small sequence of notes as was illustrated, you are ready to play them on a MIDI synthesizer. To do this merely press the `m' key on your keyboard while the mouse pointer is positioned anywhere in the spectrogram window.
(If you do not hear the MIDI representation but instead see an error message like "couldn't execute timidity", you will need to do some configuration. Timidity is a free midi player available for many platforms. It is usually installed in most new Linux operating systems. For Microsoft Windows, you can substitute the media player which is found in various places depending on the version of your operating system. (To find it, you need to find it in the start/ programs /accessories list and determine its properties.) For Windows PC, it is strongly recommended that you use Winamp (available from winamp.com) as your intermediary for playing MIDI files. Once you have located and tested an application for playing MIDI files, you must tell this program in one of two ways. The easiest way manner is to go to the cfg menu button and select miscellaneous. Now using the browse button, find the midi file player and open it. The other way is to edit the file scribe.ini and replace the path the desired executable for the variable `player'.)
You may hear a few wrong notes. You can adjust the pitch of the note by selecting the note using the mouse pointer. It should appear in green and now adjust it up or down using the up and down keys on your keyboard. The `d' key will delete this note, the + and - keys will lengthen and shorten the note. The left and right arrow keys will move the note.
The MIDI file may not be played on the instrument of your preference. To change it, you should click the cfg button and select the notation radio button on the top. Now press the `midi program' button and select the desired instrument. The slider on the left, allows you to adjust the volume level (velocity) to use in creating the MIDI file.
Now we shall try a few other interesting experiments. To start
load the project file drowsy.prj. This will load a fairly complete
annotation of this file. You can hear the entire annotation by
pressing the 'M' key. You have probably heard a couple of out of
tune notes. Now go to the auxiliary menu and select pitch plot.
The following plot should be placed on your screen.
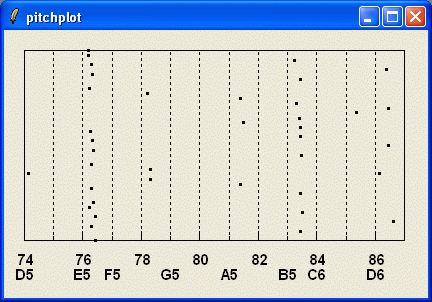
This plot shows the pitches of the notes as measured from your
annotation onto a grid. The grid lines correspond to the correct
frequencies of the notes assuming a 440 Hz tuning for the key
of A. It is apparent that the tuning of this recording is quite
far off which explains why some of the notes are off.
The program allows you to change the tuning by resampling the
file. This was described in the scribe.html documentation in
the htmldoc directory. You will find this feature useful
in a lot of your work.
The reason why some of the notes are out of tune is because the program quantizes the pitch to the nearest MIDI note. Some notes may be rounded up and others rounded down which may introduce a semitone error (flat or sharp). You can manually correct these notes using the edit features described above. When you select a note (i.e. appears as a green bar), there is an annotation along the bottom line of the window which tells you the pitch in midi units and the corresponding key. The fourth note should be D instead of D#. You can lower it using the down arrow until the annotation specifies the correct note. The note will not appear exactly over the black bar in the spectrogram, but this is unavoidable in this situation.
This file is one of the rare examples where you can use the
program's autograb feature available from the auxiliary
menu. If there are any note annotations, in your window remove
them by pressing the `E' (for erase). Now open the autograb
window accessible from the auxilliary menu. Press go. The program
should automatically find all the notes withen the frequency
range specified by the two sliders. This completes the discussion
for this audio file, however, we shall return to it later when
we discuss the tools for converting the MIDI representation to
music notation.
Now let us move on the file geambaseasca.wav
recording geambaseasca.wav. The spectrogram
which contains a short excerpt from a Romanian dance call Geambaseasca de la
Tortomanu.
Before giving you some exercises to try, there are a couple of
common problems that you should be aware.
2) Though the start position is indicated by a vertical cursor,
the program only plays a few milliseconds when you click on the
play button. You probably dragged the mouse cursor slightly specifying
a small area. Erase the dragged area by double clicking and
try specifying the start point again.
3) The frequency resolution of the program seems inadequate
even though the largest FFT size window was selected. The sampling
rate of your file is probably 44100 Hz or larger. The program runs
best if you resample it to 11025 Hz or around that.
4) When increasing the frequency resolution and expanding the
vertical scale, the spectrogram has a salt and pepper appearance.
The canvas height is probably inadequate for the spectral resolution
you are using. Go to the cfg/spectrum menu and increase the canvas
height by a factor of 2 by entering the new size in the entry
box. The spectrogram should have a smoother appearance.
The next example,
zagroski.wav.
the matching tones technique is a lot more difficult to apply.
This is part of a Croatian dance called Zagrosky Drmesi.
The situation is very similar for the vocal section of the
the Croatian song. It is not too clear whether it is better
to view the spectrogram at a resolution of 1024 or 512.
Ajdza Milim Ajdza Dragim.
All timing information are recorded in MIDI pulse units, where
the number of pulses per second depends on the tempo of the music.
In order to convert the MIDI file to music notation it is necessary
to know the length of a quarter note in units of MIDI pulses.
The header of the file contains a variable called PPQN (pulses
per quarter note) for this purpose. The time signature by default
is assumed to be 4/4, however the MIDI standard provides a means
of indicating the time signature in the tempo meta command.
In order for scribe to provide the correct information it is necessary
for you indicate the beat of the music by inserting bar lines.
To illustrate the general process, we return to the simple tune
Drowsy Maggie. To save some time load
the project file drowsy.prj into scribe.
If you have created scribe.abc, you can view it using any text
editor since it is a regular text file. This is an abc format
music notation file for which there are some free notation
programs. If you do not have your own music notation software, then
you can download various programs from sourceforge.net.
When you convert the MIDI file to `common music notation' you should
get something similar to.
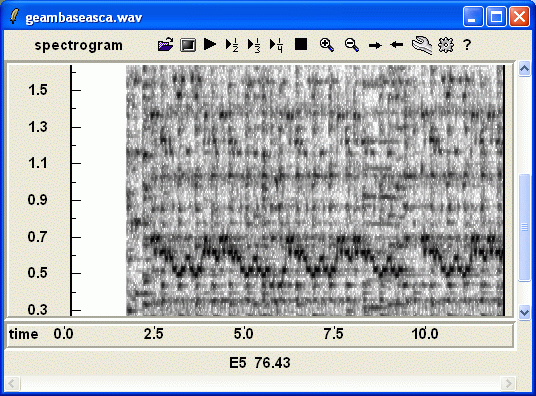
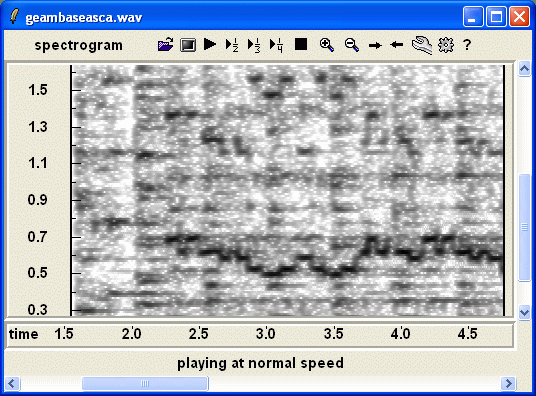
In this example, you hear a solo clarinet accompanied by various
string instruments. It is not too difficult to find the clarinet signal
in the spectrogram; however, the tempo is a lot faster and it is necessary
to zoom into a smaller time segment to see the details. In this example,
we also use a shorter window (FFT size = 512) so that the temporal
details do not get smeared. After a few adjustments the spectrogram
image looks like the following.
The autograb function could be used to identify most of the notes,
but I found it necessary to edit some notes manually in order to
get a reasonable representation. If you load the file geambaseasca.prj,
you can see and hear my interpretation. It was found useful to slow
the music down by a factor of 2 by adjusting the rate parameter
in the programs menu. This also slows down the playback of the MIDI
file generated by the program.) This file also illustrates
another feature of scribe. When you play the file, you also hear
a bass accompaniment. These were also notated, but you must switch
to track b in the cfg/notation menu. The track a annotations
will become invisible but the other annotations will now appear.
Things to beware
1) The program does not respond to the space bar command. If you
have more than one window on the screen, the programs focus may
not be centered on the spectrogram's window and will not pick
up the keyboard commands. You should change the focus using the
tab key or clicking on the top border of the spectrogram window.
A mouse click anywhere on the window may be sufficient. For
some operating systems such as Linux, you may configure the
window environment so that focus is always shifted to the
window where the cursor is placed. The Windows PC environment
does not seem to have this feature.
More difficult examples
In most of you applications, it will be more difficult finding
the note fundamentals in the spectrogram. Often they are barely
visible. To start, open the file
brahms.wav.
This is the beginning of Brahms clarinet sonata in F minor
Opus 120, no 1, with Gary Dranch on the clarinet. The tune begins
with a clarinet accompanied by a piano. The piano accompaniment
introduces a lot of clutter making it fairly difficult to identify
the fundamental of the clarinet; however, it is fairly clear
once you find it.
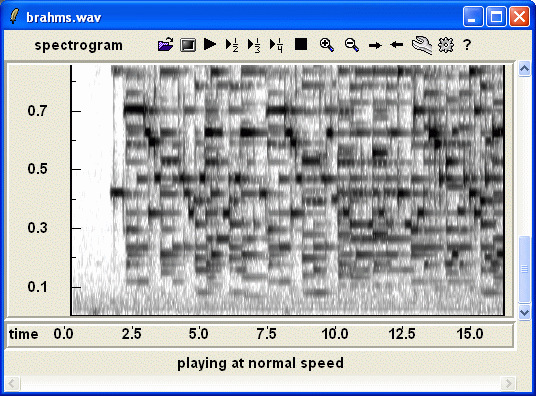
The easiest way to find the clarinet is by matching tones by finding
the position of mouse pointer where the space bar tone matches the
tone of the clarinet when you right click. To see the solution
load the project file brahms.prj into the scribe application.
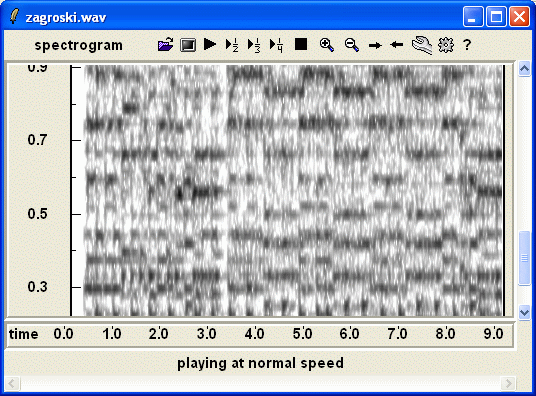
The problem is that the melody is carried by a sequence of
chords making it more difficult to pick out the pitch. None of the
notes in the chord seem to stand out visually. Nevertheless
they are all there; load the project file zagrosky.prj for
the solution.
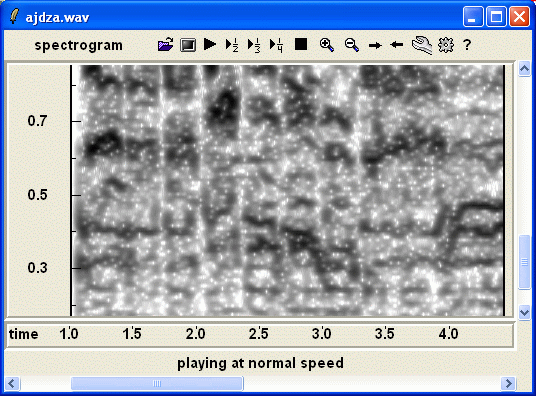
As a hint, the vocalists sing in the range of 300 to 500 Hz.
Creating a Music Transcription
So far, we have ignored the problem of creating a transcription
to common music notation from the MIDI file. This requires converting
the file into a music notation format. There are about 50 music notation
programs as well as music notation formats. Fortunately they can
all export and import MIDI files. If you intend to produce a MIDI
file that will be imported into a music notation program it is
important to ensure that it contains some additional information.
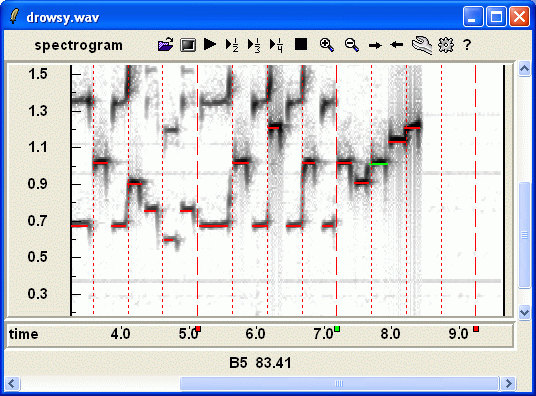
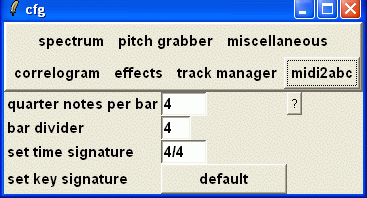
First go to the cfg/notation configuration page and change
the number of quarter notes per bar to 4, the bar divider to 3,
and time signature to 4/4. The configuration page should look like below.
Now to place bar lines on the screen, position the mouse cursor to
the position of the first bar line and press the key `b'. Next use
the F3,and F4 to adjust the bar line spacing. If you hold the
control key down, the bar line spacing will change faster. Make
fine positioning adjustments using the F1 and F2 keys. The dashed
vertical bar lines indicate the positions of the bar lines while
the dotted vertical lines divide the bar into quarter notes.
If you load the project file drowsy2.prj, scribe should be configured
correctly. Finally press the key `a', and you should see the
message scribe.abc was created at the bottom of the screen.
(If you instead get an error message like "couldn't execute midi2abc
no such file or directory" then you may have to indicate in the
cfg/miscellaneous configuration window the correct
path to midi2abc.exe.) In any case, scribe will generate a MIDI
file called scribe.mid independently whether it also created
scribe.abc. The MIDI file should be found in the scribe folder
or wherever the scribe program was executed from.
