
MusicScribeKit is a toolkit for transcribing music from a recording to common music notation. It allows you to slow down music and create a MIDI file. Unlike other wav2midi shareware programs the MIDI file is not created automatically. Instead it is created manually by annotating the spectrogram displayed on the screen. The program is also an educational tool for learning to interpret audio spectrograms.
To use this program, you require some knowledge of musical notation as well as some understanding of the physics of sound and audio spectrograms. The program can present three different visual representations of the audio file. The spectrogram is the most familiar representation and has been used for speech analysis. The midigram is a variation of the spectrogram in which the vertical axis has been distorted to fit the geometric progression of the music scale. The correlogram replaces the power spectrum with the autocorrelation function. It has been found useful in exposing harmonic tones which are obvious to the listener but invisible in the spectrogram. At any point the user can switch from one representation to the other. Furthermore there are various modes of auditory feedback linking the visual representation.
The program consists of a tcl/tk script and a number of shared libraries (eg. dll's) which do some of the work. For Windows, users it is possible to make it available as as a single executable with Tcl/Tk builtin. The program uses the Snack audio package available from http://www.speech.kth.se/snack/ and a few customized shared libraries built from C code. If you are planning to build the program from sources, you should read the documentation making scribe.
To start you need an audio file, preferably no longer than a couple of minutes and sampled at a slow rate like 11025 or 16000 Hz. Your computer should be fairly fast (of the order of Ghz), so that the horizontal scrolling function runs smoothly. The program will handle higher sampling rates like 44100 Hz, but may behave sluggishly, if your computer is not fast enough. Since the program works best with files sampled below 16 kHz, it is recommended that you resample using the function subsample and save to file which is found under the tools menu of this program. This will be described later. Alternatively you can use a free program such as wavesurfer available from http://www.speech.kth.se/snack/. You should also convert stereo files to monophonic representation since scribe will only process one channel.
On windows, you start the program by clicking on scribe.exe. For other operating systems, you start the scribe.tcl script under wish8.4 (assuming that the Tcl/Tk and the Snack2.2 package have been installed.)
Once the main window is displayed, you will see a set of menu buttons represented by icons. Hovering the mouse over any one of the icons will display a drop down explanation (balloon help). For example, the icon represented by an open folder will is the Open menubutton.
Once the main window is displayed, you go to the File/Open menu
item and open your audio file. By default only the RIFF wav
files in your directory are listed, however the program is
capable of reading many other formats. Click on the file type
menu bar to select any other audio file type. Once the file
has been read, its spectrogram will be displayed on the main window
and will look something similar to below. (The time scale marked
in seconds.)

Note the text line "loaded audio file ..." appearing below the spectrogram.
The program will display important messages and hints on this line.
Clicking the info button will display a short description
of the file in a separate window. This includes the number
of samples in the file, the sampling frequency, the extremes of the amplitude,
number of channels, header size in bytes, and file format.

At this point, you can listen to the file by clicking on the triangle on the top menu bar. A moving vertical line will indicate the position in the spectrogram while the music is playing. To stop the music click on the black square on the top menu bar.
Clicking once on the spectrogram will place a marker (a vertical red line) on the spectrogram. If you press play now, the music will start playing from this marker. To remove the marker, double click anywhere on the spectrogram.
If you are transcribing the music, you will likely wish to start with a small chunk. Dragging the mouse pointer over the spectrogram while depressing the left mouse pointer will select an area in the spectrogram. When you release the mouse button, this area will be highlighted. If you click the play button (black triangle) only the highlighted area will be played. If you wish to hear it at slow speed, click on any one of the black triangles followed by a fraction. (Some music is played very fast and it is difficult to hear all the details in that speed.) Prior to playing the music at slower speed, the program will have to compute the resulting signal causing a short pause. Therefore it is recommended that you zoom into a short excerpt consisting of just a couple of seconds. Provided you do not change the selected area, the program will remember the resulting signal. So if you click the same play button again, the music will start playing immediately.
It is probably more convenient to zoom into the selected area. You do this by clicking the Zoomin menu button (represented by a magnifying glass encircling a plus sign), and a new spectrogram will be displayed. You can now horizontally scroll the spectrogram by moving the lower scroll button. Since the program must recompute the viewed spectrogram, the response could be sluggish on some computers. The menu buttons marked with a horrizontal arrow using angle brackets, will also scroll the spectrogram by a small amount. This is used for fine adjustments.
Another menu button marked ZoomOut does the reverse. The selected region will grow by a factor of two unless you do a "full" unzoom. The left, right and center options specify whether the region grows at the left, right or both.
Besides playing the music at slow speed there are several other useful signal processing operations. For example, the recording may be off concert pitch for several reasons or the music may be performed using a difficult key signature. You can transpose the music by a fraction of a semitone or larger to avoid this difficulty. These special effects are accessible by clicking the configure menu item. (This is represented by an icon of a wrench.)
A configuration window shown below will pop up.

If you now select the effects radio button, the cfg window will
show additional controls. Moving the tranpose slider allows
you to specify the amount of transposition.
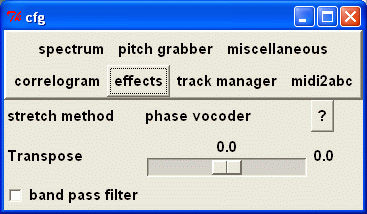
The transcribe slider changes both the speed and pitch of the music
since it is not critical that the exact tempo is preserved.
When you click the play button, the music will be resampled to a lower
or higher rate and the music will sound at a different pitch.
If you zoom out to the full screen, you have to option of transposing
the entire file and saving it to a new file using the menu item
tools/transpose and save to file. (The tools menubutton is
represented by an icon of a gear.) This may be useful if you are
planning to do a lot of work with this music.
The effects menu sheet also allows you to select the algorithm
for stretching the music when you are playing it at slow speed.
You have a choice of three methods called vsola, wsola,
and phase vocoder. The first two run in the time domain and
require less computing; however the last method usually produces
the best quality output. When you are slowing down by a large factor,
the music may sound distorted, in particular the percussion instruments.
If you are going to use the bandpass filter processing described
next you should select the phase vocoder in order to enable
this feature. (The bandpass filter is built into the phase vocoder.)

The bandpass filter becomes useful when you are trying to listen to the bass accompaniment which may sound rather weak and drowned out by the treble instruments. To enable this filter you would tick the band pass filter check box and adjust the top and bottom frequencies. To extract just the bass, I typically cut out all frequencies above 200 Hz. You also have the option of saving the filtered music in a separate file using the tools/filter and save to file function.
You will notice a small button with a '?' appearing somewhere in the configuration window. The question mark button appears in many of the windows and clicking the button will display context help for using this particular feature.
These are the basic features that you will probably use. When you exit the program, it will save all the current setting in a file called scribe.ini so that when you resume the program, most of these settings will be restored. The next section describes the more advanced features that require some knowledge of signal processing and physics of sound.
First we shall discuss the various visual representations
available in this program. A spectrogram is a two dimensional
map of the signal's energy versus frequency and time. Dark
regions indicate high energy while light regions indicate low
energy. The picture below shows the spectrogram of the first
seconds of a soprano recorder solo.
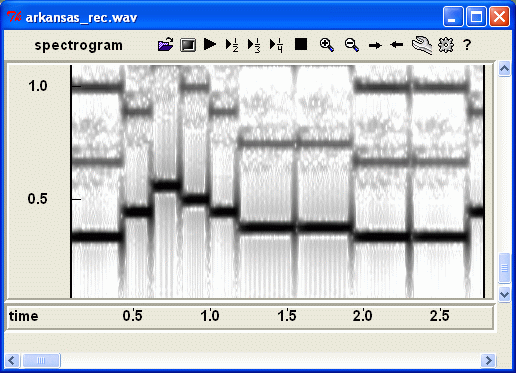
The vertical scale is in units of kHz. The first black bar at
the left of the end of the spectrogram (from time 0.25 seconds)
around 340 Hz is the key of E. The following note at 440 Hz
is the key of A. To change visual representation click on the
top menu item marked spectrogram (besides File), and a choice
of three representations will drop down. Clicking on midigram
will display the following image.
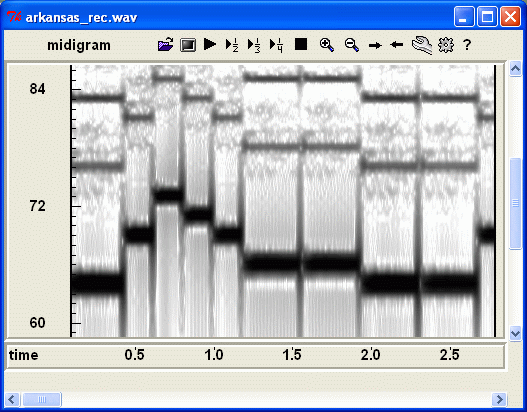
The image is very similar to the spectrogram except that the
vertical scale has been distorted and marked in MIDI pitch units
where 60 represents middle C. Now selecting the correlogram,
produces something very different.

The horizontal bars are a lot wider due to the nature
of the autocorrelation function. (Sharp peaks in the power spectrum,
correspond to broad sine waves in the autocorrelation function.)
The vertical scale is in units of sample delay. In this example,
the audio file was sampled at 16000 Hz, so the horizontal bar
centered at 41 sample units corresponds to the period of the
340 Hz signal for the key of E.
It is useful to view the actual spectrum and autocorrelation function
at a particular time instant. This is done by placing the red vertical
cursor at a specific position and pressing the letter u on your keyboard.
Two graphs are displayed in separate windows labeled spectrum and
autocorrelation. (On some systems, it may be necessary to move
the windows if they are on top of each other or obstructed.)
These windows are illustrated below.
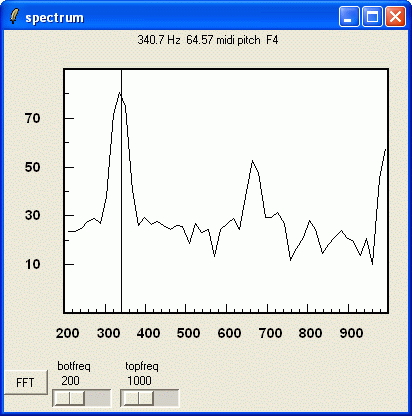

These windows, like all the other windows in this program are
resizeable. When you resize it the graph will be adjusted
to fill the window. Furthermore these windows have additional
controls that will be discussed later. When you move the
cursor over any of these graphs you will see a vertical
black line (cursor) and a label on top indicating the position of
the cursor in various units. For example for the above spectrum,
the cursor is positioned at 340.7 Hz which corresponds to the
MIDI pitch 64.57 about half way between the key of E and F.
(The recorder was not playing in tune.) In the autocorrelation
graph, the cursor was placed at the lag of 45 samples which
corresponds approximately to 356 Hz, the MIDI pitch 65.33 or
the key of F.
There is an FFT menu button which allows you to select the length of the FFT (512, 1024, 2048, 4096) and two horizontal sliders which adjust the horizontal scale of the plot. The horizontal scales allow you to zoom into any area of the graph by specifying the frequencies at the left and right edge of the graph (labeled botfreq and topfreq). For the autocorrelation, you can also specify the window length (FFT) and the horizontal scale (maxlags). The other two sliders (low freq) and (high freq) specify the frequencies of band limited filter which is applied to the power spectrum before transforming it to the autocorrelation function. These last two sliders become useful when the spectrum is more complex.
If you increase the top frequency of the spectrum by
moving the slider to the right, you will notice there
are other peaks at higher frequencies. These are called
partials or overtones. The partials occur at multiples
of the fundamental frequency and are responsible for
giving the musical instrument its distinctive tone.
The flute and recorder have few partials and its
waveform look like a sine wave.
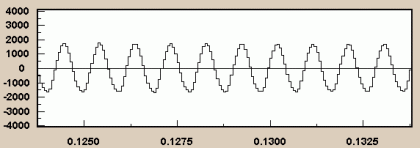
The piano has a much richer tone and many partials.
Here is one sample of its waveform

(Note scribe does not have the capability of displaying
the waveforms shown above.)
If you look at its spectrogram, you see many
parallel lines. Only the fundamental at the lowest
frequency is significant to the music transcriber.

When two or more notes are played at a time,
you may get a mess.
Unfortunately, the spectrograms of real recordings
are rarely this clear. The presence of room reverberation
and percussion instruments and noise blur the spectrogram.
A sample of such a spectrogram is shown below.
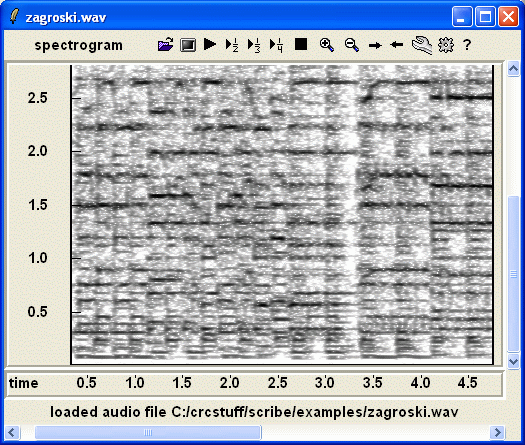
It is therefore useful to have some control on how the
spectrogram is displayed. To do this, click the
cfg menu item and select the radio button labeled
spectrum parameters in the cfg window.
The following frame should now appear in the cfg window.

The configuration window allows you to alter the
fft window length and how the spectrogram is mapped
unto the screen (brightness, contrast and top frequency).
It is recommended that you adjust these parameters to
make the details of interest most apparent. All the
sliders, act immediately on the displayed window.
The log preemphasis control emphasizes the higher
frequencies at the expense of the lower frequencies.
This comes in handy when the music has a strong
base or a DC offset. The canvas height entry (here 600)
only acts after you close and restart the application.
If you choose, you can display the spectrogram using a
rainbow of colours rather than a gray scale.

In some circumstances, this may help display some of the
hidden information in the spectrogram. The brightness
and contrast controls still affect the spectrogram but
in a different manner. If you plan to annotate the
spectrogram using the features described below, you should
use the greyscale representation rather than the colour.
If the fundamental which carries the melody is weak,
it sometimes help to use the correlogram representation
shown below.
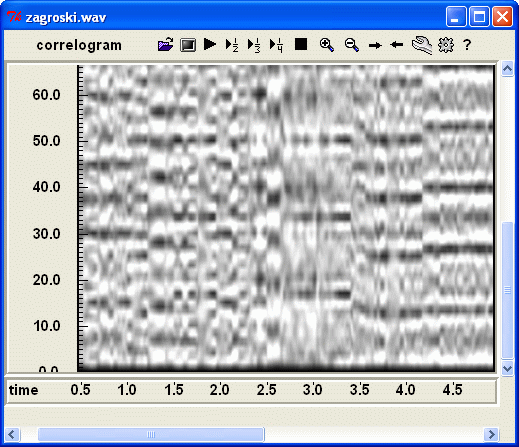
There seems to be less clutter and there is a
separate configuration window to help extract the
information of interest. The correlogram has had
little use in signal processing, so not much is known
about it.

The dynamic range of the correlogram is alway between 1 and
minus 1 so we only need a brightness control. maxlags
specifies the maximum delay (vertical scale) displayed in
the correlogram. The delay corresponds to the period of the
signal, so there is an inverse relationship between frequency
and delay. (Small delays correspond to high frequencies.)
The correlogram is computed from the inverse of the spectrogram.
By bandpassing the spectrogram prior to transforming it to
a correlogram, we can tune the correlogram to particular
frequency ranges. This is useful for music containing a lot
of harmony. You use the low freq and high freq
sliders to select the frequency range.
If you plan to use the annotation features, it is recommended that you also go through the examples referenced here, scribe examples. You can download this entire collection of examples from this zip file examples.zip.
Though almost all the annotation features can be done with menu buttons, it is strongly recommended that you use the keyboard short cuts. They are listed in a table displayed when you click the help/bindings menu item and they are shown below here. The most important keys are the space bar and g which work together with the mouse pointer. When using the keyboard, be sure that the scribe window is in focus or else it may not detect the keystrokes. On Linux and Unix systems you can configure X11 to focus on the window containing the mouse cursor. Otherwise, it may be necessary to click the mouse cursor on the border of the window to establish focus. On Microsoft windows, this option does not seem to be available, however you can configure scribe to behave in this manner by checking the focus follows mouse box in the cfg/miscellaneous configuration box.
To start, switch to the spectrogram or midigram representation. Be sure your displayed (zoomed) area is not more than a couple of seconds wide or else you will miss all the detail. Place the mouse pointer somewhere in the spectrogram, close to the fundamental of interest and then press the space bar. A purple, horizontal line will overlay the spectrogram corresponding to this position and you should hear a short beep corresponding to this frequency or pitch. (It is recommended that you stay below 1 Khz since most of the musical octaves of interest are in the lower frequencies.) Without, moving the mouse pointer horizontally, right click the mouse. You should hear a short excerpt of the music corresponding to this position in time. This excerpt is called a snippet. You goal is to adjust the height of the mouse pointer so that the pitch of the beep associated with the space bar corresponds to the pitch of the snippet. You can right click or press the space bar as many times as you want as you position the mouse pointer. You should find that this position matches a peak or horizontal dark bar in the spectrogram.
Now that you have established the pitch or frequency of the note, you need to specify its duration and position in time. This is done by dragging the mouse pointer while depressing the left mouse button. This will highlight a yellow area in the spectrogram when you release the mouse button. Once this is done, you press the g keyboard key to grab this note. A red bar should overlay the spectrogram. (If you move the mouse pointer over the red bar, it will turn green.) Use this procedure to annotate other notes in the spectrogram or midigram.
Several comments are appropriate at this point. At any time you can switch to any other of the three visual representations of the music. The annotated notes will be placed in there correct positions for either of these representation. The length of the snippet can be adjusted using from the cfg/miscellaneous menu window. The loudness and characteristics of the beep can be adjusted in the cfg/pitchgrab menu window. The amplitude should never exceed 32000. The square wave is the harshest and loudest sound. I am not sure what the shape factor does. You do not have to position the mouse pointer exactly over the peak, since the program will search for the peak in a small neighbourhood of the mouse pointer. The size of the neighbourhood is configurable. If the order of the fft is small, you should stick with small neighbourhoods. The exact position of the peak will be interpolated if you have the enhance check box ticked. When you press the space bar, the key and midi pitch will displayed on a text line below the time label bar.
The program contains various editing features for fixing mistakes
or fine tuning the annotation. First you move the mouse pointer over
the note that you wish to edit. This should turn this note green
indicating that it is the note under focus. Pressing d
will remove this note. The arrow keys will shift the position
of the note. The + and - keys will lengthen or
shorten the note. (If you have difficulty remembering the magic
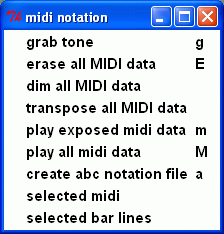
key strokes, you can also drop down the controls menu by clicking on
auxiliary/midi notation menu button. The following menu,
will appear.) Pressing E will delete all the annotation
in event that you wish to start over.
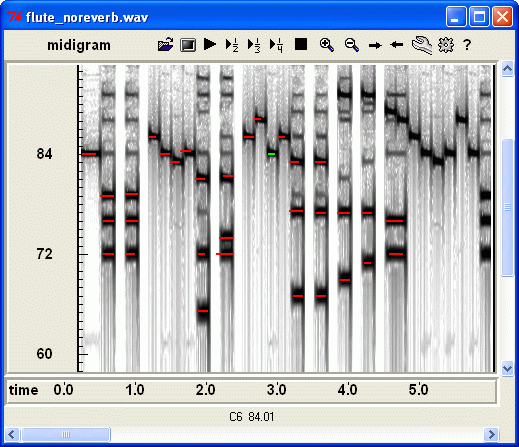
Eventually, your spectrogram or midigram will look something
like the following image. If you wish, you can create a MIDI
file and automatically play it by pressing the key m.
This will play only the exposed part of the annotated notes.
If you wish to play everything (exposed and unexposed), press
the key M.
The midi instrument which plays this sequence of notes is
also selectable. To change the current instrument go to
the cfg window and click on the button labeled "track manager".
The following frame should be exposed.

If you click on the button labeled "midi program" a list box
will appear with the possible choices. Double click on your
instrument and close the list box. The next time you press
m or M that instrument will be used. The scale widget on
the right allows you to adjust the MIDI velocity (volume
level).
Type 1 MIDI files are organized in tracks. Scribe allows you to separate your MIDI annotations into two tracks called track a and b. Normally, I would use track a for annotating the melody and track b for annotating the bass accompaniment. When scribe starts up on a new audio file, it is set up to place all annotations in track a. If at some point you switch to track b, all the track a annotations will become invisible and only the track b annotations if any will appear. When you create and play the MIDI file, you have a choice of creating and playing both tracks or only the track selected for editing.
Now click the button labeled midi2abc.

The entry boxes for time signature, quarter notes per bar,
and bar divider assist you in creating an abc notation file
and are described later.
Scribe allows you to created an abc notated file, but before you do this you must place bar lines on your spectrogram, so that the program will be able to figure out the length of a quarter note. In fact if you intend to create an abc music notation file, you should place the bar lines first prior to picking the notes. This way you can avoid placing notes which overlap bar lines resulting in messy ties. To place bar lines, first place a marker (vertical red line) where the first bar should begin and then press the key b. Equally spaced bar lines will be placed from this marker. You can make fine adjustments using the keys F1, F2, F3 and F4. The F1 and F2 shift the bar line grid to the left or right. The F3 and F4 adjust the spacing between bar lines. Holding the control key while pressing the F3 and F4 keys will speed up the spacing change by a factor of 5. Though menu buttons exist for positioning the bar lines, they do not have auto repeat so it is recommended that you use the keyboard shortcuts instead.
The figure below illustrates the spectrogram with bar lines overlain.
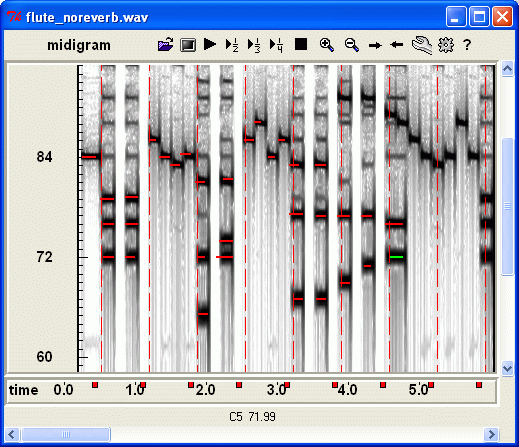
(This audio file was created from a MIDI file so the timing is
very regular.) You will find that the tempo is less exact real audio
files so that the bar lines do not always fall over the beginning
of a beat. To fine tune the position of the bar lines use the
following procedure. Going left to right, find the first bar
that you wish to shift. Pass the mouse pointer over the red square
below the barline (in the time marker frame). The square should
turn green. Now if you press the l (el for lock) on your
keyboard, this will lock all the barlines to the left. The squares preceding
this bar should all turn black. Now, the F1,F2,F3,F4 keys
will only affect the other bar lines. Continue, this same procedure
always progressing from left to right. Note that if you wish
to unlock locked bars, just turn one of the black squares
back to green by passing the mouse pointer over it and press the
letter l again. Unlocking locked bars will cause
you to lose the fine adjustments that you have made. You can
unlock all bars by selecting the first bar line and pressing the
l key.
I usually place the bar lines so they correspond to the music that I am notating. To assist in the placement of notes, it is convenient to subdivide the bar into smaller units corresponding to beats. The bar divider entry box is used to specify how the bar should be subdivided.
When creating a music annotation file, you would like to it to have a specific time signature. This is controlled by another entry box.
Once you have specified the number of quarter notes per bar line as one of the notation parameters in the cfg window, you can create your abc file by pressing the key "a". (You may use decimal numbers to specifies number of quarter notes for certain rhythms such as 7/8 time.)
There are about 50 different music notation formats. This program supports only one format abc for which there is a lot of ree software. You can find out more about this notation from Abc Home Page. The program first creates a MIDI file and then calls a program, midi2abc to convert it to an abc file. The output file is called scribe.abc. Once you have created the abc music notation file, there are many programs to convert to produce a score in Postscript, print it or display it on your screen. The abc file will probably need additional editing if it will be useful to musicians. If you plan to use scribe for music transcriptions, it is recommended that you go through the examples given in musicscribe examples.
Scribe depends on two programs to do other functions. One is a MIDI player
which takes a MIDI file and plays it through your speakers. The other is a
program which converts the MIDI file into abc music notation format. You
need to specify the path to these programs in the entry boxes. You can
do this by browsing through your directory structure.
This is specified in the cfg/miscellaneous configuration windows
in separate entry boxes. (You may use the browse button to find
those executables.)

You may also select one of several algorithms
for performing the time stretching in the cfg/effects configuration
screen. There is a choice of three algorithms called vsola, wsola and
phase vocoder. The latter is probably most accurate but uses
the most processing power.

Besides transposition, you can also band limit the audio output.
To use this feature you must choose the phase vocoder time stretcher
and tick the band pass filter check button. Now you can adjust
the lower and upper frequencies. I find this feature useful when you
are trying to listen to the bass accompaniment which may be masked
by the melody.
When you press the space bar, scribe responds with a tone whose pitch depends on the position of the cursor in the spectrogram. The loudness, duration and timbre of the beep can be configured here in the cfg/pitch grab

It is not necessary to position the mouse pointer precisely when adjusting
the pitch of the note. The program looks at the local spectrum and finds the
nearest maximum in a local neighbourhood around the frequency specified by the
position of the mouse. The size of the neighbourhood in spectral bin units
is specified here. This neighbourhood should be about one or two units
especially when the notes are in low registries and the FFT order is not
high. Low notes pose another problem because the spectral representation
may not be adequate to resolve the keys of the musical notes. You can
adjust the window size by chaning the FFT size variable. If you tick
the enhance square, the program will refine the pitch estimate by computing
the rate in which the phase of that spectral component changes with time.
Pressing the help button will display a short brief set of instructions in a separate windows. Certain keyboard keys provide additional controls and are listed when you select help/binding. These bindings will be described in other parts of this documentation.
Normally, when you exit, the program saves all your settings and work in a file called scribe.ini. If you are working on several audio files, you may wish to archive your results in separate files. If you click the menu item File/save project the file will be saved under a different name that you select. It is recommended that you use the file extension prj.
If you do not wish overwrite the current scribe.ini file with your new settings and data you can perform a fast exit by typing X on your keyboard, or closing the application using the operating system instead of the normal way (file/quit or q). Note you must use upper case X since lower case x is an editor command in the VI editor.
If you are creating your own audio file, you should quantize the signal to 16 bits rather than 8 bits to reduce the noise. The sampling frequency should ideally be in the range of 16 to 22.05 kHz. Since only one channel is displayed, you should record the audio as a monophonic file.
The melody is usually played in the higher registries. Often the fundamental of the melody is obscured by the many partials of the bass accompaniment. To find the fundamental of the top line or melody, look for a periodic pattern of partials in the higher frequencies. It will probably be necessary to compress the vertical frequency scale by setting the top frequency close to its upper limit. You will have to make many auditory checks using the space key and right mouse button.

Produced by midi2abc

After some cleaning up
First the bar lines are in the wrong place leading to many tied notes. Since the performer was playing this tune very quickly, the duration and placement of the notes was approximately correct. However, at that speed you would need a very good ear to notice the errors. Furthermore the inaccuracies are probably part of the interpretation of the piece. It is probably a separate project to develop an intelligent algorithm which produces a meaningful output from the score.
Several new functions (some experimental) accessible through the auxiliary menu item have been introduced to scribe.
The function findkey is used after you have midi notated part of the file. It will determine the pitch histogram of the notated notes and try to estimate the key and tuning for the piece. The key is determined by minimizing the number of accidentals. The pitch tuning is determined relative to A = 440 Hz.
The function autograb will display a new configuration window

which controls a tool for automatically extracting the notes from
the audio file. The audio file must be a RIFF WAV file, since the
application that performs the operation, specmid.exe can only handle
one type of audio file. Using the auto control, you specify
the range of frequencies where you should extract the notes. This
is specified in kHz if the spectrogram is displayed or in MIDI pitch
units if the midigram is displayed. The minlevel, cuts out those
notes whose intensity are less than a specified level in dBs.
The minlength cuts out those notes which are shorter than
the specified number of frames. This corresponds to a specified number
of samples (determined by multiplyig this number by the
frame shift value). You can control the resolution of the
analysis using the fftmenu item. Clicking the go
button performs the analysis and you should see some red bars
displayed on the spectrogram or midigram corresponding to the
notes that were extracted. Adjust minlevel click go
again till you get something reasonable.
The octave -1 button will transpose all the notes down by one octave. This is a useful feature, when the fundamental of the notes are weak but the first partial are much stronger. You select the range of frequencies so that specmid extracts the first partials instead of the fundamentals. This will return notes one octave higher. Then transpose down by one octave. Since the pitch estimation algorithm is more accurate for the higher frequencies, it is sometimes better to extract the notes from the first partial. (Low notes are may be too close together in the spectrogram.)
The function transpose and save to file is used to produce an output wav file with the transpose value you selected in the cfg window. Be sure that the spectrogram or midigram displays the entire file before doing the save. Also it is not recommended that you overwrite the original until you are sure that the output is acceptable.
The function pitch distribution plots the MIDI onset time
(vertical scale) as a function of MIDI pitch. The onset time is
not very interesting and is used to merely spread the notes over
a two dimensional space. This function is useful for detecting
musical instrument mistuning. The MIDI pitch scale is based on
A = 440 Hz. If the instrument is on tune then all the pitches
should lie close to the vertical dotted lines as seen below.
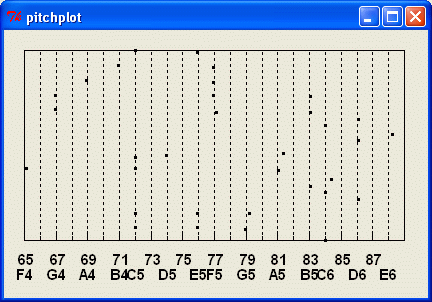
If the pitches fall in between the dotted lines,
the instrument is slightly mistuned.
You can correct this problem by transposing the entire file by a fraction of a semitone and storing it as a new file. The function findkey will also indicate the amount of mistuning; however, this is only reliable if all the notes are mistuned by the same amount. This is not always the case, and for some musical instruments the tuning could drift with time.
The functions pitch meter and tape recorder require you to have a microphone attached to your sound card. Clicking the tape recorder allows you to view the spectrogram of a signal you create by recording from a microphone. The following window should appear on the screen.

When you click the record button the program will start
acquiring the signal from the audio input and displaying
a scrolling waveform on the screen. (If you see just a flat
line, no input is coming because the microphone is muted.)

When you click the stop button, the waveform will be replaced
by a spectrogram (or midigram) of the entire signal recorded.
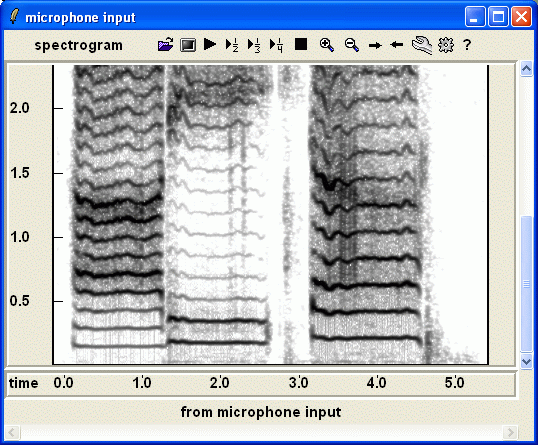
You
can record up to 1 minute at a sampling rate of 11025 mono.
The pitch meter function can be used to tune your voice
or musical instrument.

Click the On button and sing or play a note. The
signal strength and pitch should be shown.

The number following the pitch indicates the fraction of a semitone
the tone is off pitch. The Off stops the recording and freezes
the last input.
subsample and save to file will resample the entire loaded signal to 11025 Hz monophonic. This is not a reversible operation; to return to the original state you must reload the same file. If you do not wish to save the output to a file you can click on the button labeled cancel.